UX Research
Addressing Digital
Fatigue at Duke
Exploring how digital fatigue impacts Duke students' academic performance, mental well-being, and productivity through qualitative research.
Role
UX Researcher & Data Analyst
Timeline
4 weeks (Fall 2024)
Methods
Interviews, Journey Mapping, Affinity Diagramming
Research Doc
View ReportThe Motivation
As an engineering graduate student, I personally experienced how constant digital demands impact productivity and well-being. Gen Z students spend nearly nine hours daily on digital devices, checking their phones 58 times a day on average. This pervasive connectivity leads to reduced blinking rates (66%), physical strain, and mental exhaustion. Understanding and addressing digital fatigue became crucial for me and my peers.
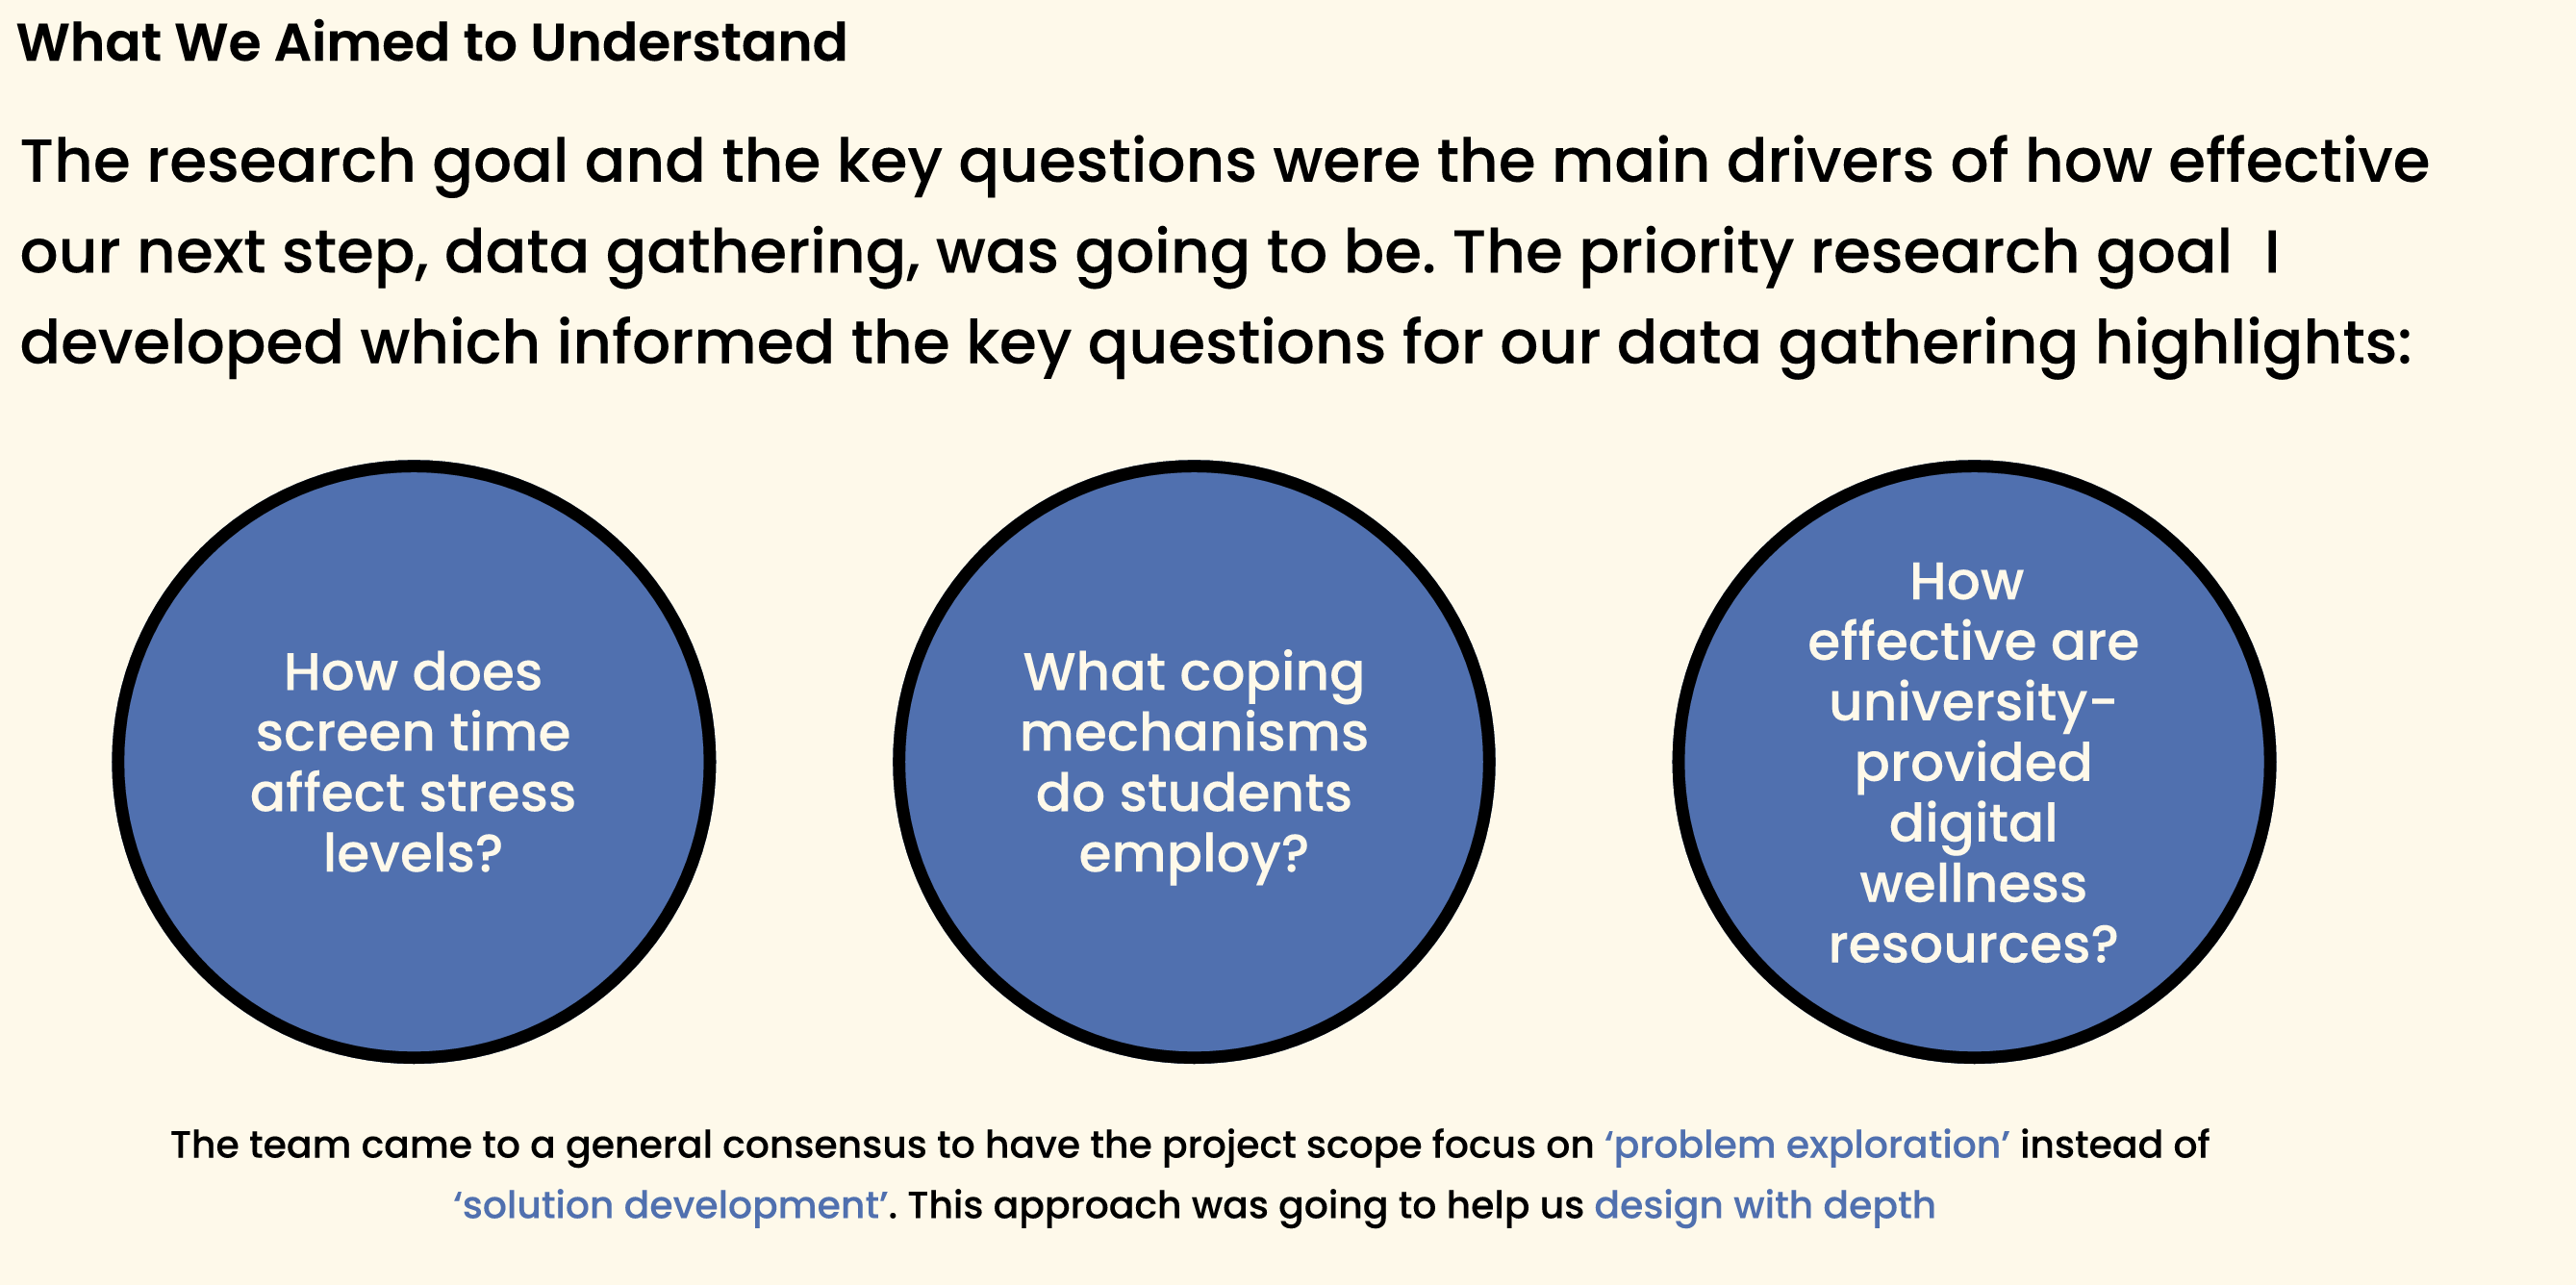
Research Goal
To conduct an exploratory study examining the relationship between digital fatigue levels and concurrent academic-career performance metrics among students over a period of one semester.
My Approach
Working with a team of 4 from the Design Innovation Studio class, I led priority research goal refinement and facilitated insight synthesis. We completed this comprehensive study in just 4 weeks, leveraging tools like Duke Box, Figma, MS Forms, Tetra, Respondent.io, and Generative AI.
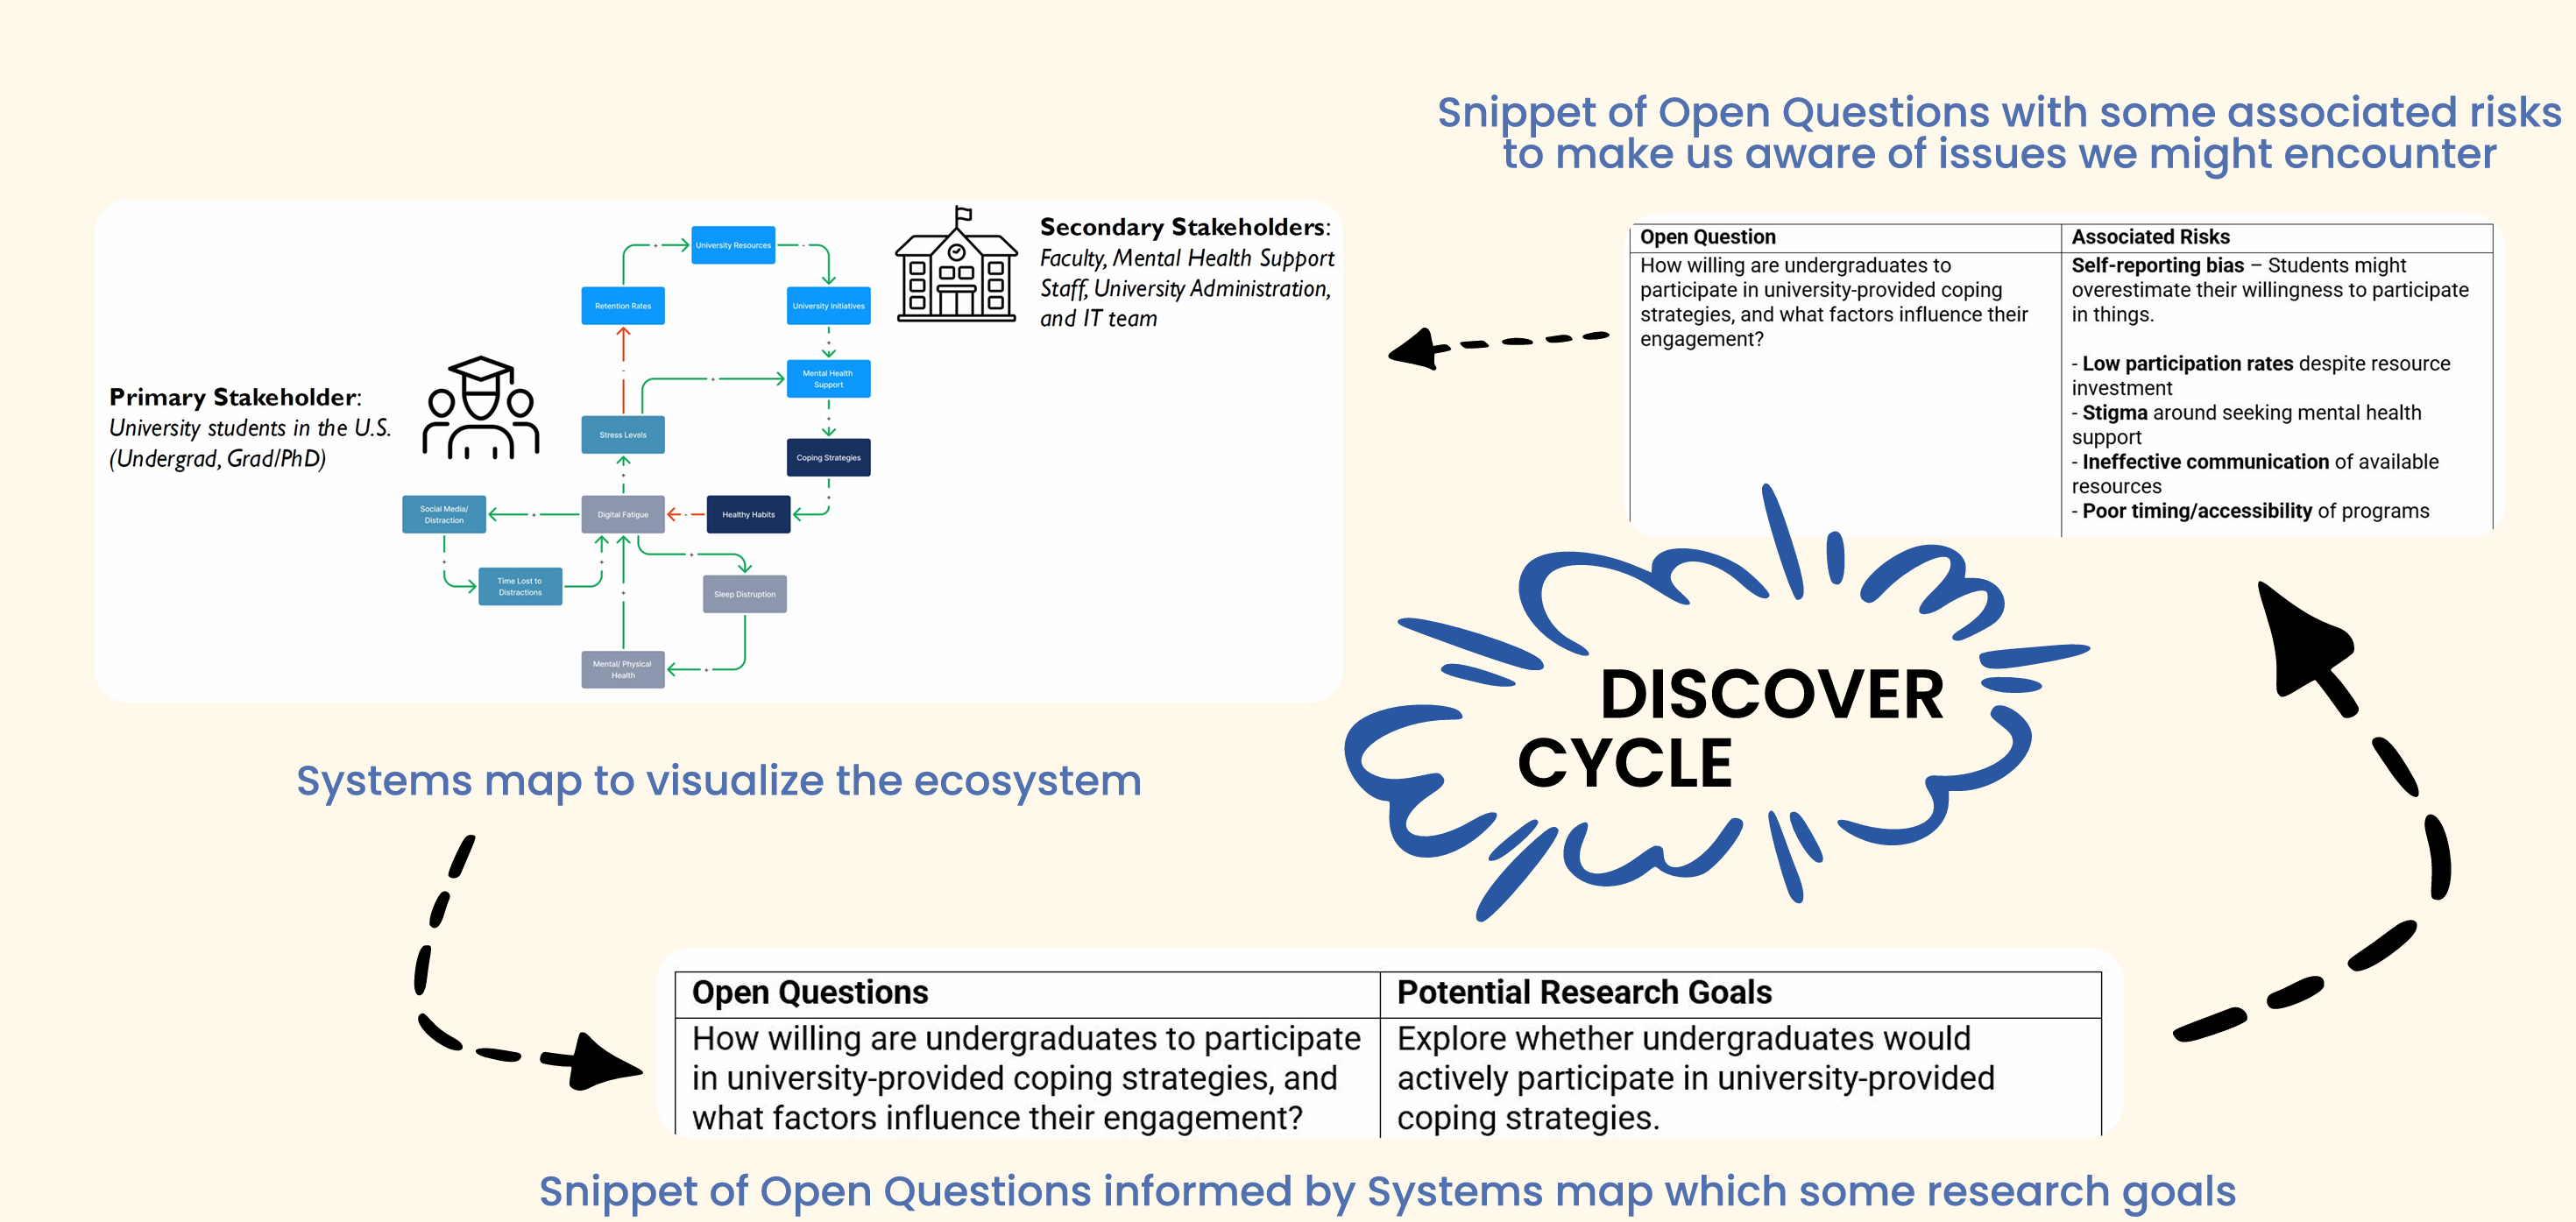
1. Discover
Developed assumptions, created systems map, crafted open questions and potential research goals
2. Define
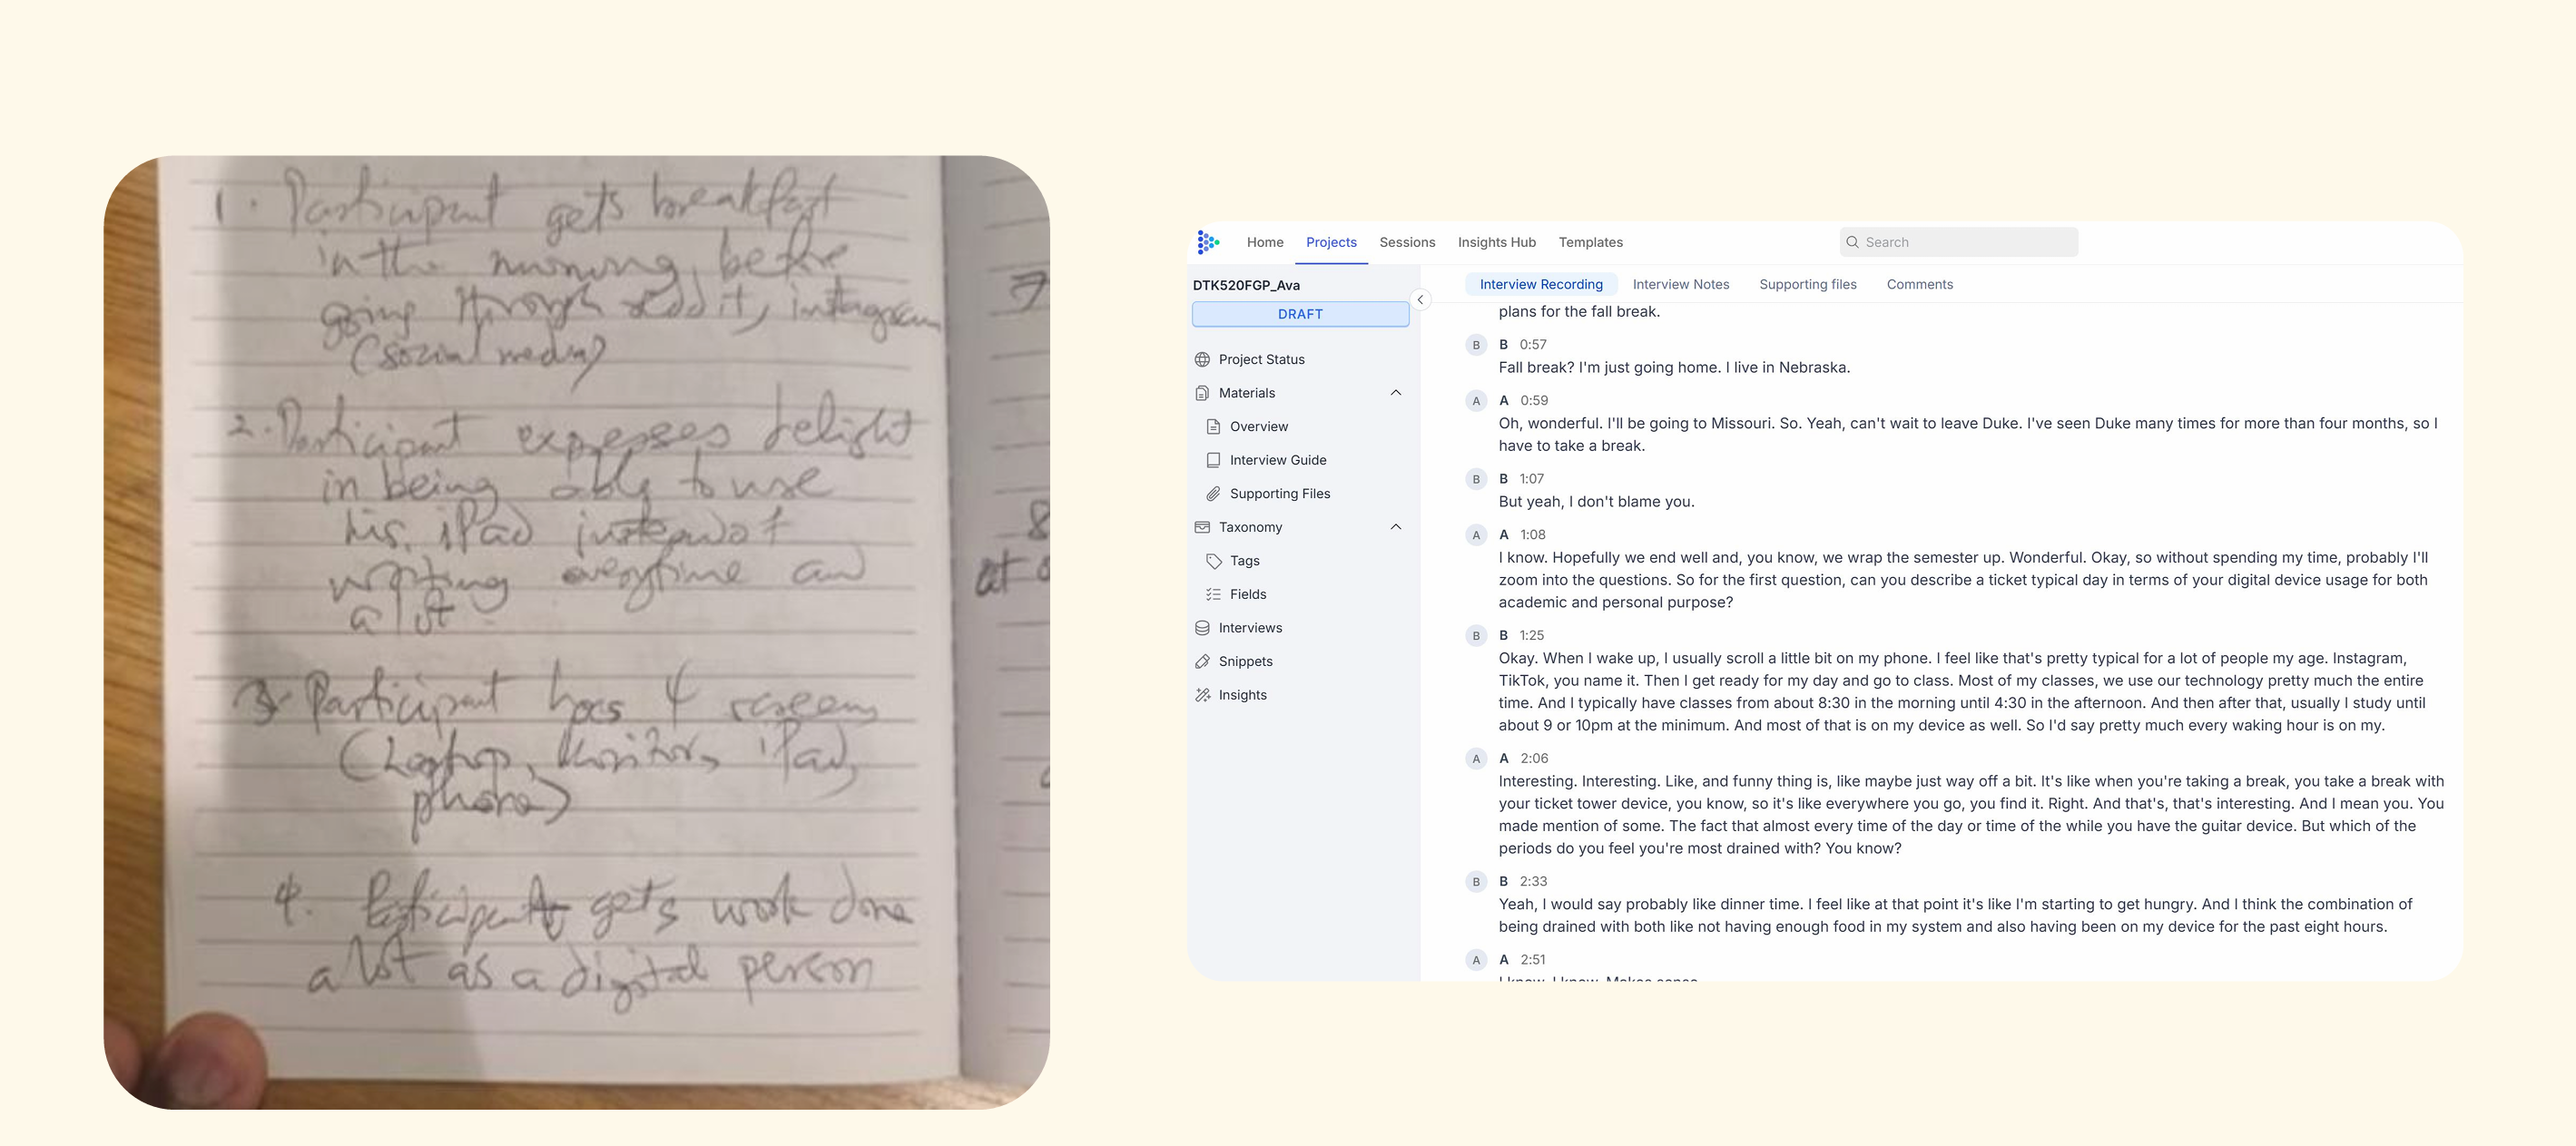
Identified key problems through screeners, recruitment, and 8 diverse interviews with students
3. Synthesize
Tagged and coded observations, conducted affinity mapping, developed insights and interventions
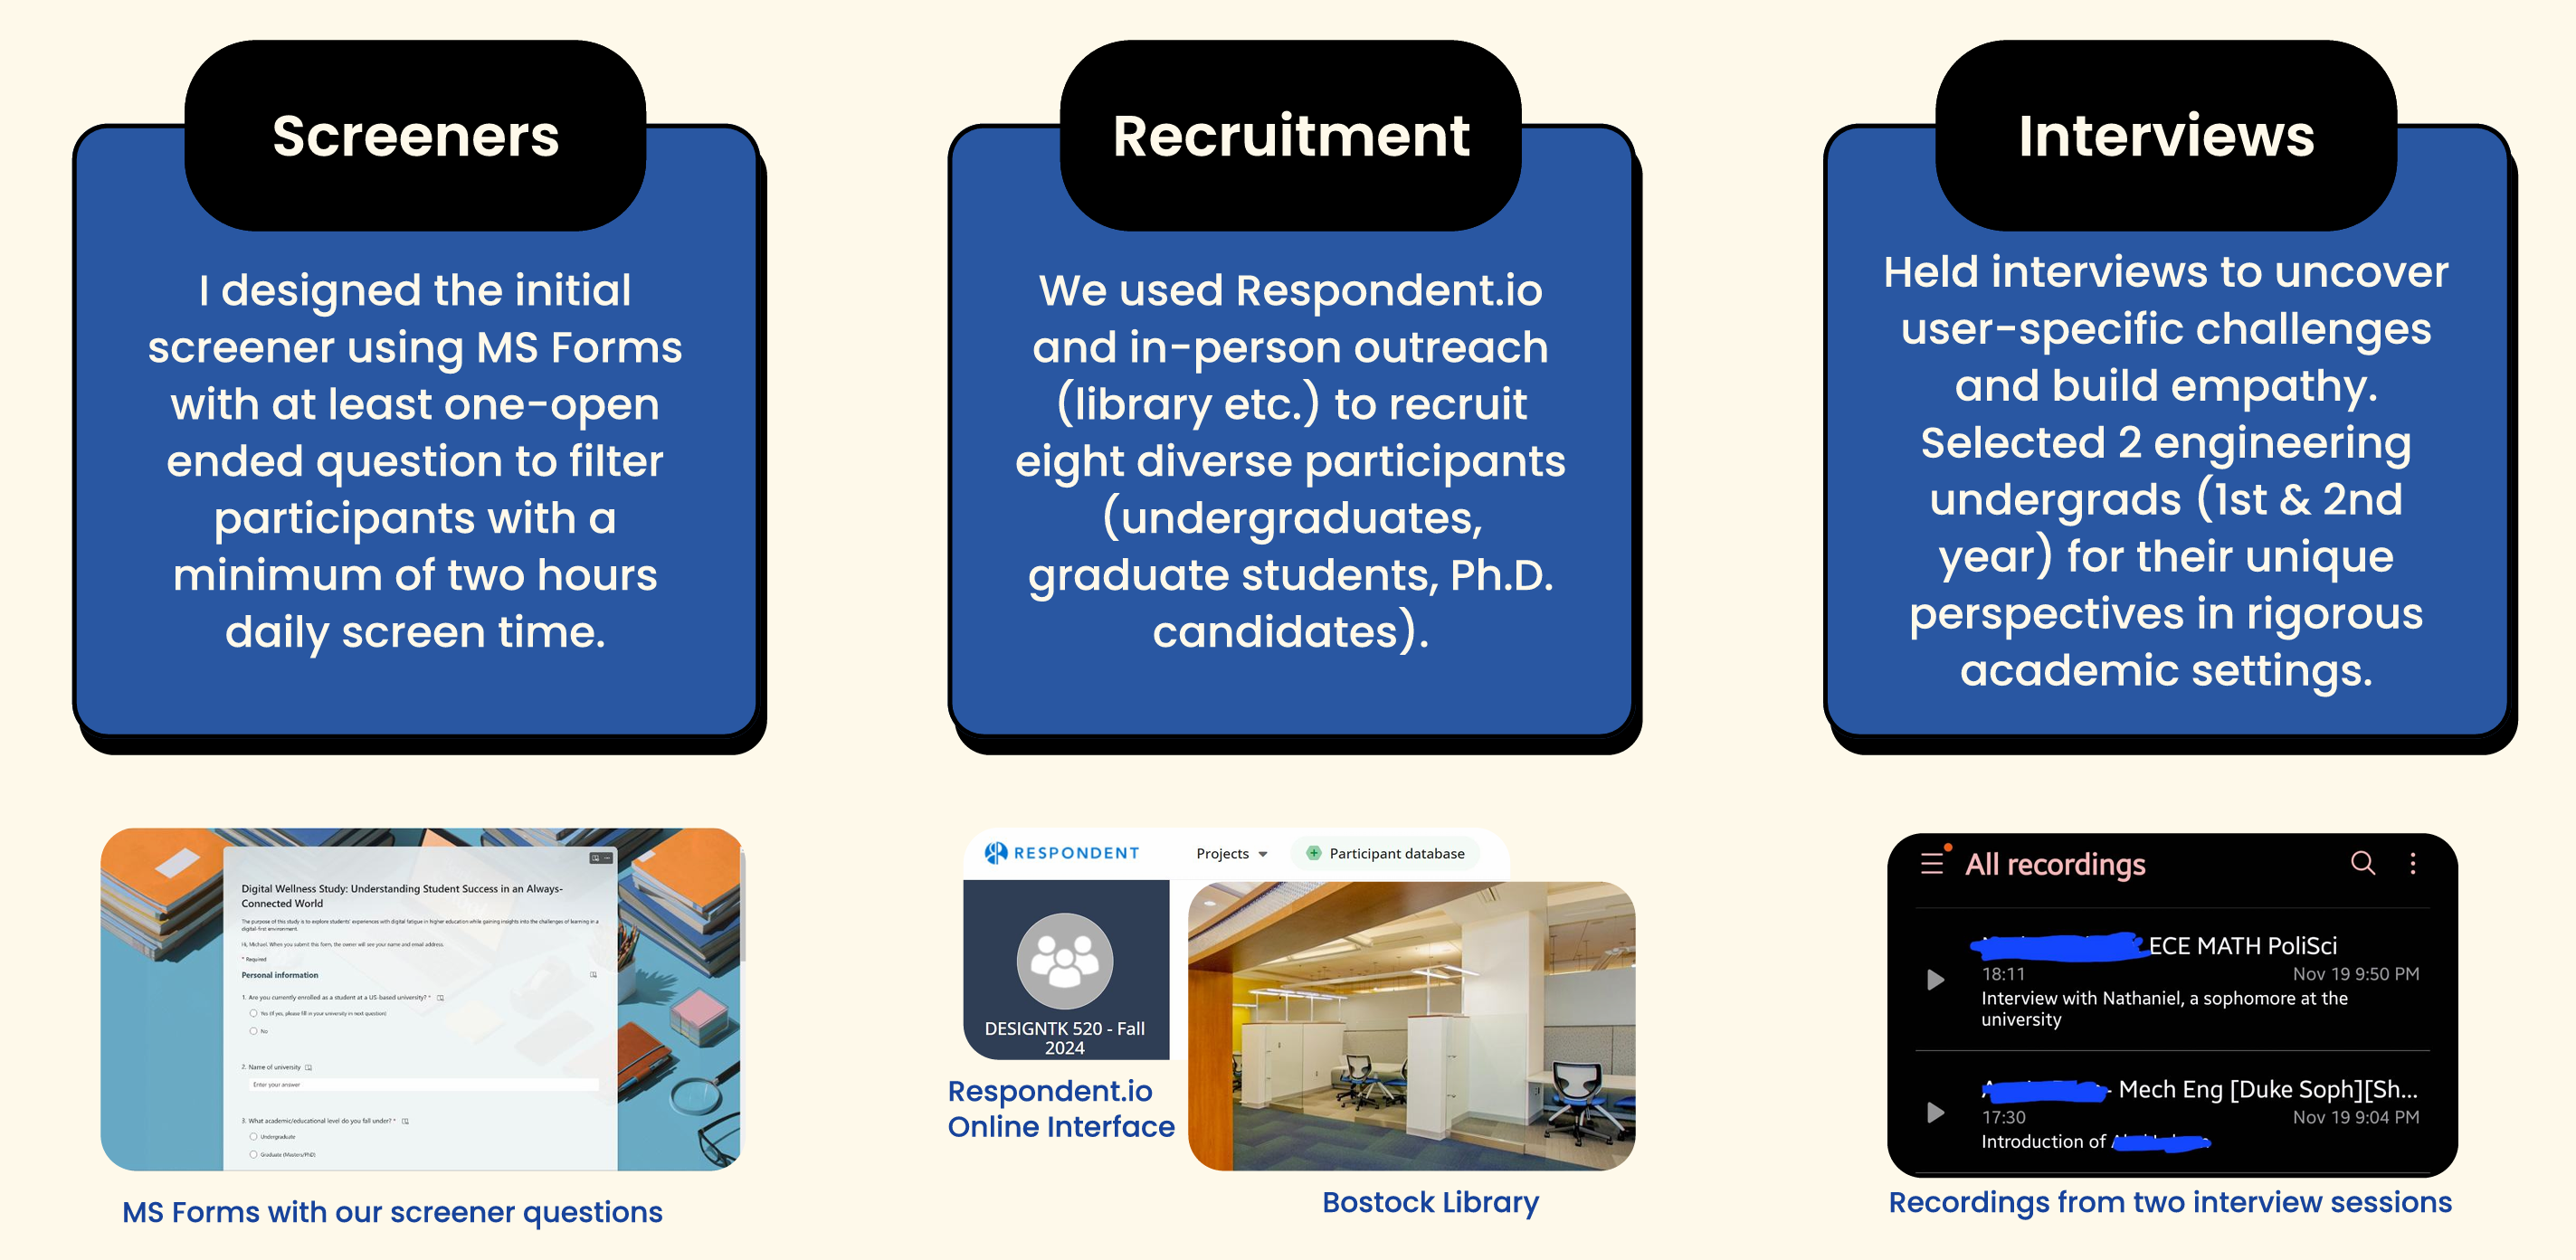
Going Into the Field
I designed the initial screener using MS Forms with open-ended questions to filter participants with a minimum of two hours daily screen time. We recruited eight diverse participants (undergraduates, graduate students, Ph.D. candidates) through Respondent.io and in-person outreach at Bostock Library.
Participant Demographics
- • Sample Size: 8 students
- • Age Range: 18-27 years old
- • Gender: 62.5% female, 37.5% male
- • Education Level: 4 Undergrad, 2 Master's, 2 Ph.D.
Key Insights
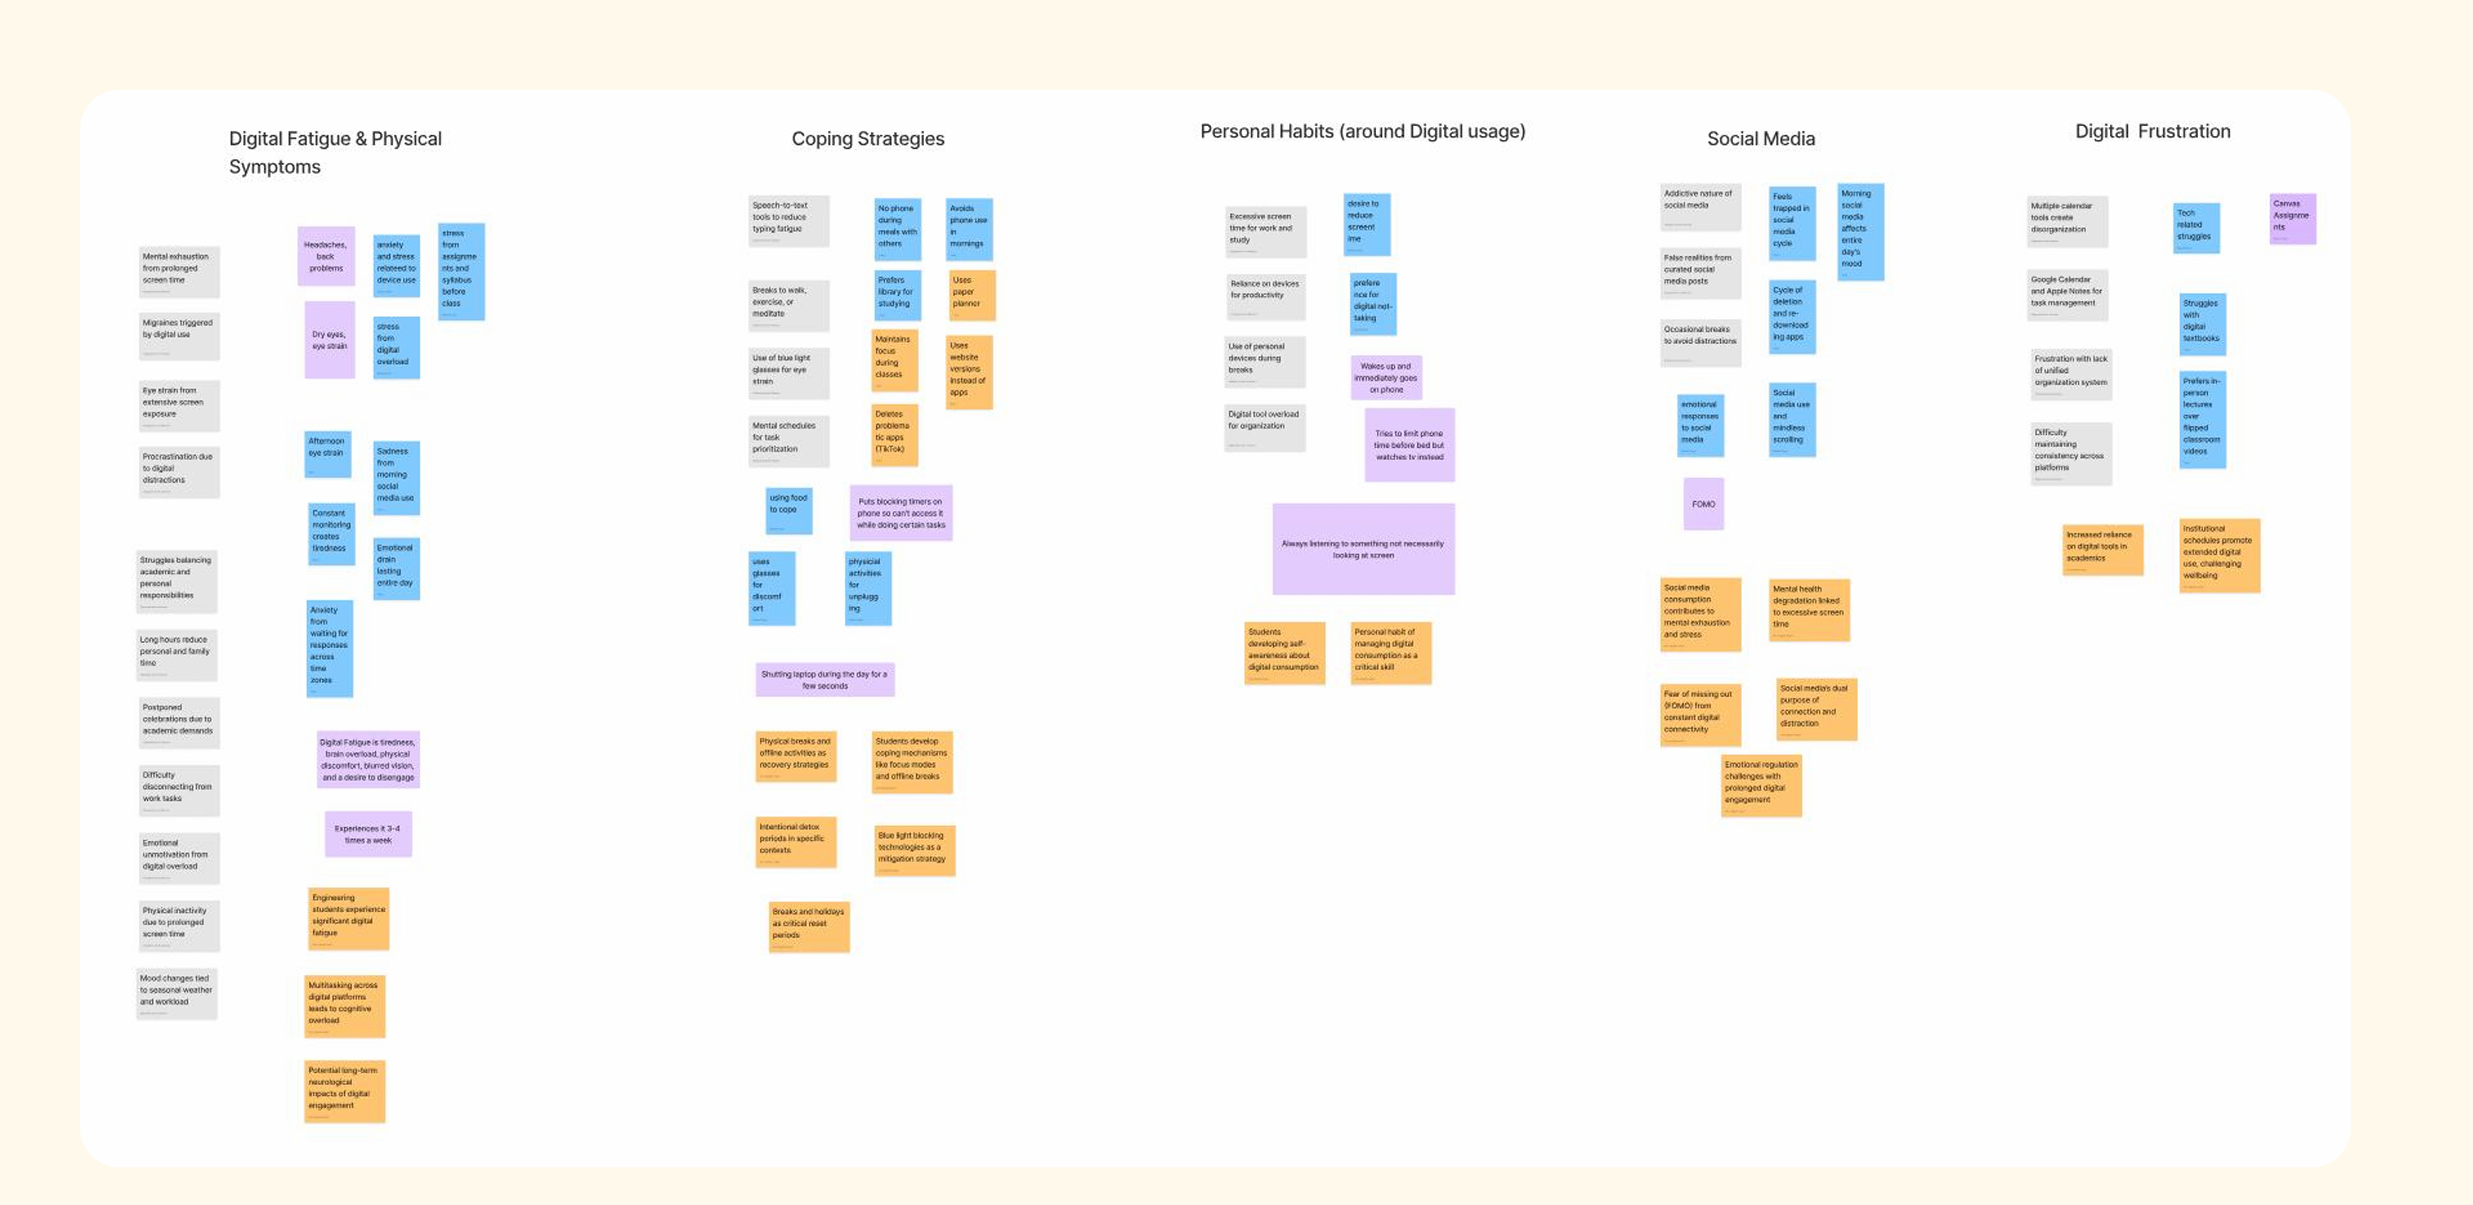
1. Digital Overload Causes Unseen Strain
Students grapple with physical symptoms (eye strain, headaches, back problems) and mental impacts (anxiety, exhaustion, potential long-term neurological effects). These issues worsen with the constant need to monitor digital platforms and the distracting nature of social media.
2. Coping Tools Are Limited
Current digital wellness tools only partially mitigate fatigue. Students need better integrated solutions.
3. Physical Breaks Matter
Offline activities like walking and exercise proved effective, but lack of full disconnection remains an issue.
4. Social Media's Dual Impact
Balancing social media's potential for connection with its role as a distraction is critical for student mental health. One participant noted feeling sad when scrolling through social media first thing in the morning, affecting their entire day.
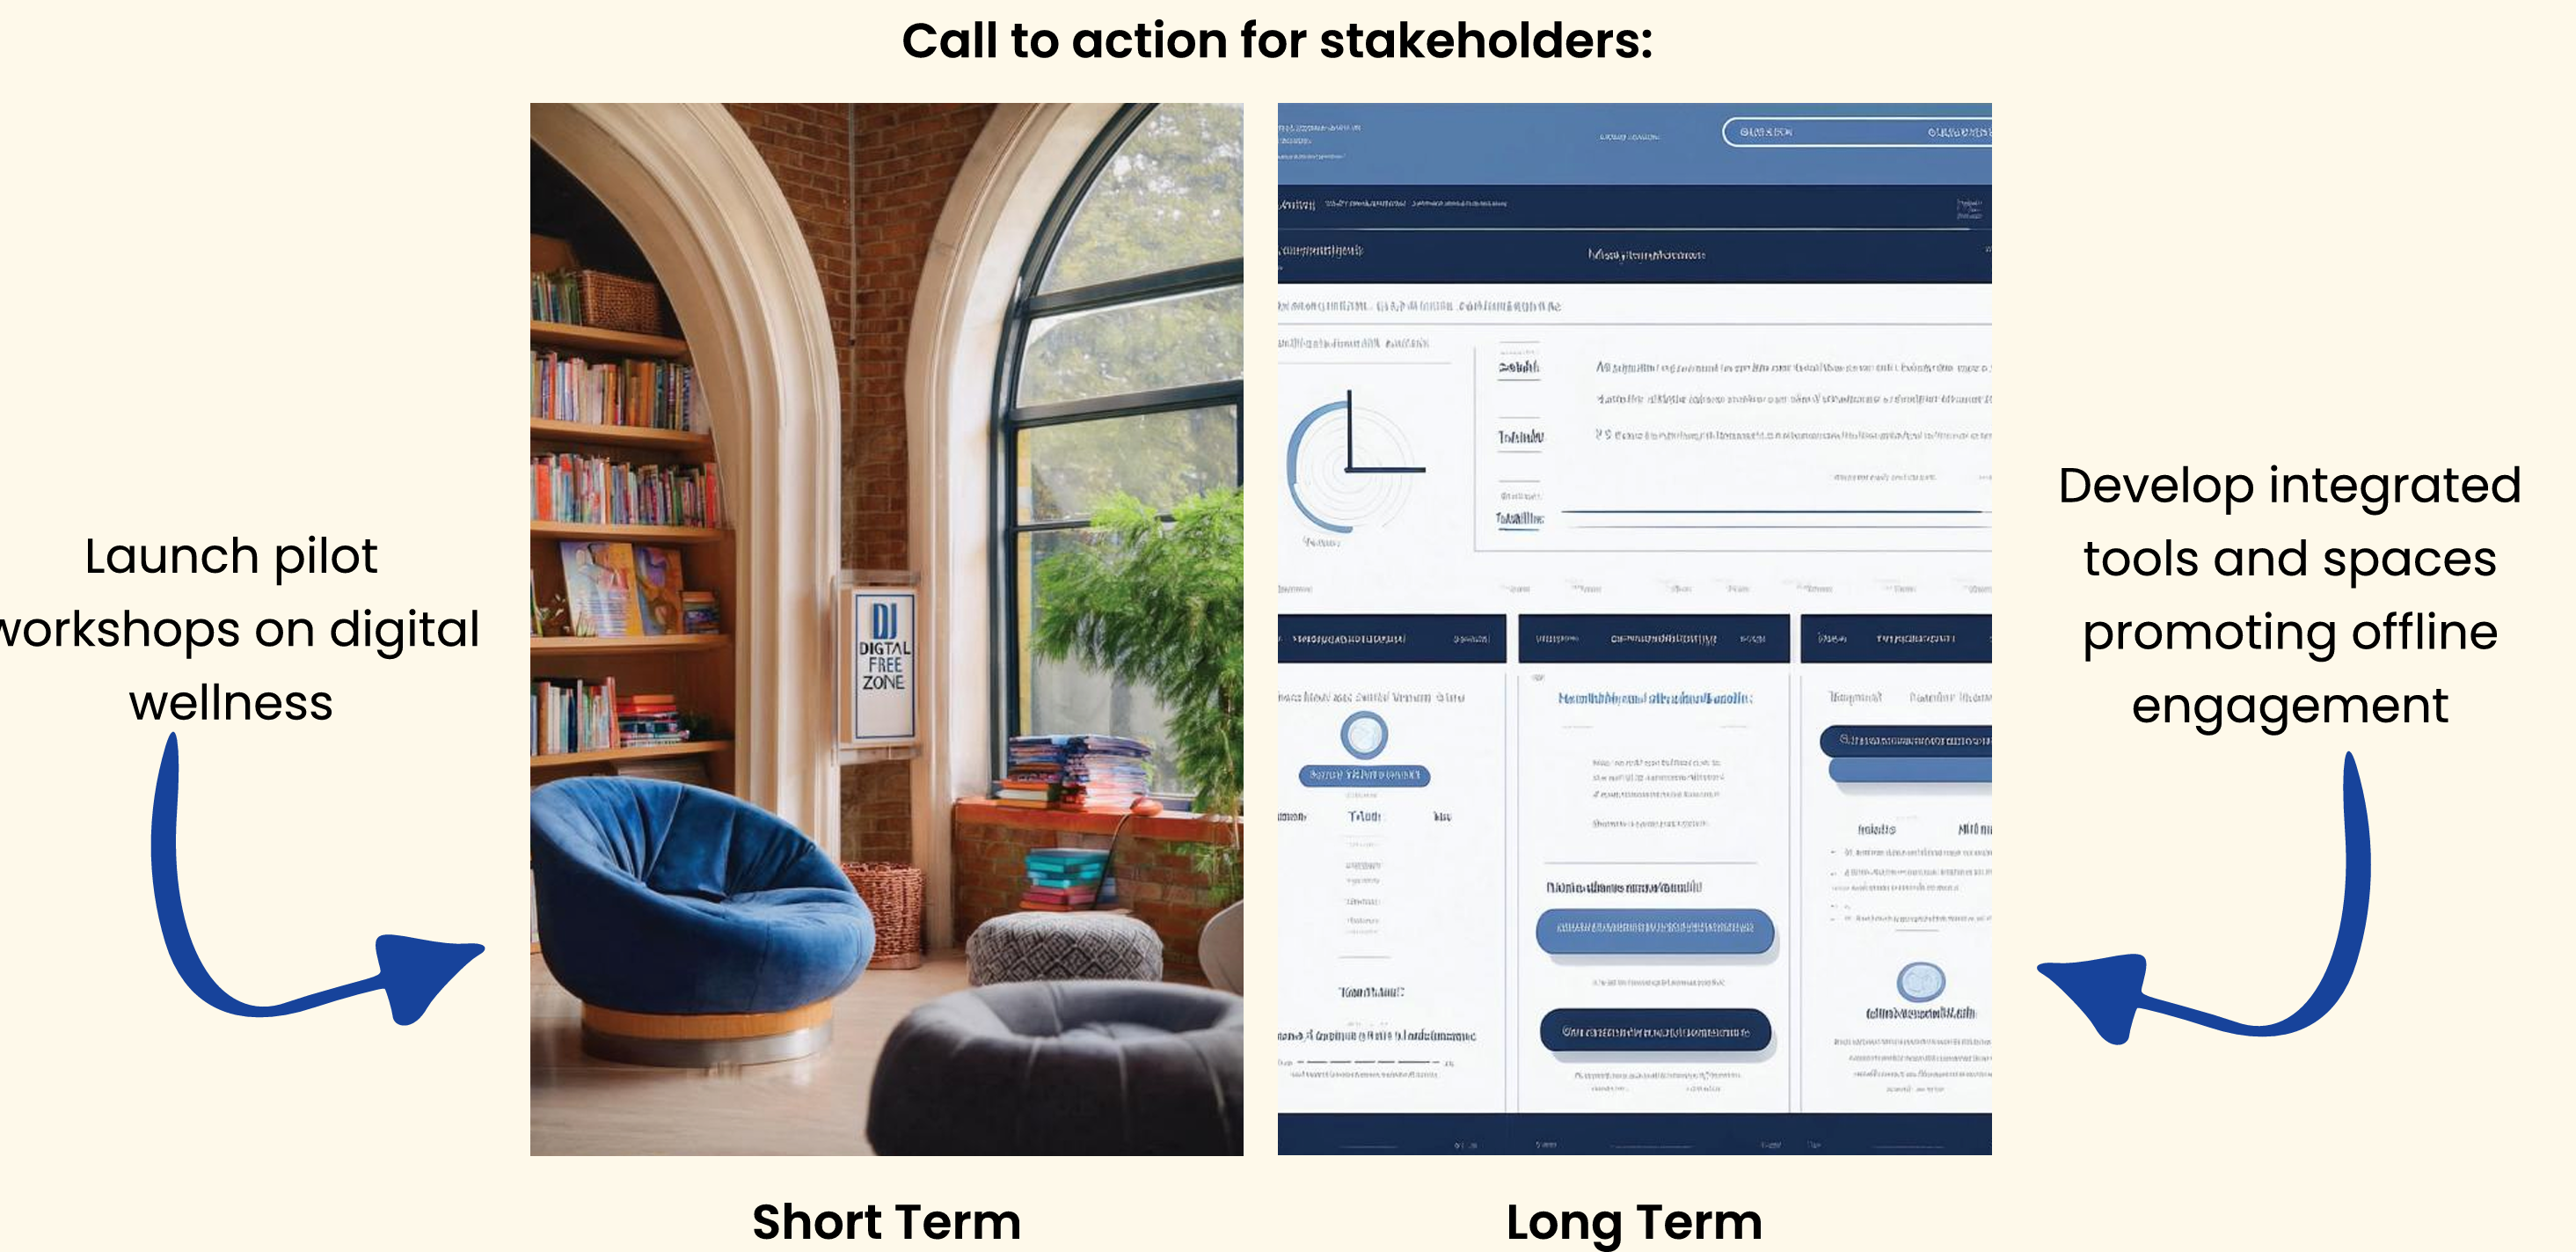
Practical Interventions
Based on gaps identified and insights gathered, I recommended practical interventions:
- • Promote awareness of digital wellness through workshops
- • Encourage regular screen breaks and provide offline activity spaces
- • Integrate tools like app blockers and blue-light filters into campus systems
- • Streamline digital tools to reduce context-switching fatigue
- • Enhance mental health support coordination
What I Learned
This project reaffirmed my passion for UX research and design. It highlighted the importance of empathy in understanding user needs and strategic thinking to propose actionable innovations. Leading the priority research goal creation and insight synthesis taught me how to transform raw data into meaningful recommendations.
"Conducting these interviews caused us to reflect on our own digital device usage, especially as graduate students. Higher levels of digital fatigue directly translate to lower academic performance—students are trying their best to cope, but believe a helping hand from the university is needed."
The Research Journey
The team came to consensus to focus on problem exploration instead of solution development. This approach helped us design with depth, understanding the nuances of digital fatigue before proposing interventions.
My Contributions
- • Led priority research goal refinement
- • Designed screener questions and filtering
- • Facilitated insight synthesis (headlines & summaries)
- • Managed scheduling and meeting logistics
- • Contributed to final presentation design
Team Dynamics
- • Collaboration taught value of diverse perspectives
- • Clear communication ensured efficient task management
- • Hybrid collaboration (Zoom + in-person)
- • Shared workspaces via Duke Box for artifact management